

News overview
The second quarter of 2019 turned out to be richer than the first in terms of high-profile DDoS attacks. True, most of the campaigns that attracted media attention appeared to be politically, rather than commercially, motivated — and that despite the fact that some security experts discern a clear fall in hacktivism in recent years.
Let’s begin with an attack that is technically outside the chronological framework of this report, since it took place on March 5 (but was reported in early May). It was targeted against a computer system regulating the supply of electricity to various districts of Los Angeles and Salt Lake City. Power supply systems in California and Wyoming also experienced problems. This is a relatively rare case of an attack on a power grid in a densely populated area. The attack was large-scale, but relatively primitive. It did not cause any power outages, but there were “disruptions in the normal operation of the systems,” as the US Department of Energy described the incident. As to the purpose and perpetrators of the attack, no information was forthcoming.
In the second half of April, there were also numerous DDoS attacks against Ecuador. As stated by the country’s deputy minister for information and communications, the websites of public institutions experienced 40 million cyber attacks of various kinds, including DDoS. The web pages of the Central Bank, the Ministry of Foreign Affairs, and the Presidential Office suffered the most. The wave of attacks was hacktivist in nature: the attackers were protesting the new government’s decision to strip Julian Assange of political asylum. To cope with the onslaught of digital indignation, Ecuador had to seek help from Israeli experts.
In early June, a powerful DDoS attack hit Telegram. The attack was carried out primarily from Chinese IP addresses, which gave founder Pavel Durov reason to link it to the demonstrations in Hong Kong; in his words, the political opposition there uses Telegram to organize protests, which Beijing takes a very dim view of.
The only headline attack this quarter seemingly driven by commercial considerations targeted video game developer Ubisoft on June 18 — just before the release of its new Operation Phantom Sight expansion for the game Rainbow Six Siege. It caused connection problems for many players, and even provoked calls on Reddit for better DDoS protection.
The largest would-be DDoS attack in Q2 turned out to be a false alarm. In late June, some segments of the Internet experienced operational issues worthy of a major DDoS offensive, but the actual cause lay elsewhere. As it turned out, a small ISP in Pennsylvania had made a configuration error, turning itself into a priority route for some Cloudflare traffic. The provider could not handle the load, and thousands of websites serviced by Cloudflare went down as a result. The WhatsApp and Instagram malfunctions were also attributed to this. It is worth noting that such Internet outages happen quite often; in this case, the scale of the problem and the involvement of Cloudflare led to speculation about a potential DDoS attack.
Meanwhile, law enforcement agencies continue to work on reducing the number of DDoS attacks within their zone of responsibility. For instance, late March saw the arrest of 19-year-old Englishman Liam Reece Watts, accused of two attacks against the websites of Greater Manchester and Cheshire police.
Note also that this quarter confirmed our earlier hypothesis about the link between the decline in the number of DDoS attacks and the rising popularity of cryptocurrency mining : NSFOCUS published a 2018 report that drew a clear correlation between the fluctuations in cryptocurrency prices and the number of DDoS attacks.
Quarter trends
According to Kaspersky DDoS Protection data, this quarter turned out to be rather less eventful than the previous one. As such, the number of attacks foiled by our protection systems fell by 44 p.p. This lull is readily explained by the traditional summer decline in cybercriminal activity. That said, compared with Q2 2018, the total number of attacks actually increased by 18 p.p., which confirms our theory about the recovery of the DDoS market. The growth trend observed since the beginning of 2019 still persists.
It should be noted that the seasonal drop in activity had little impact on attacks more technically complex (both to organize and repel): their share fell by only 4 p.p. against the previous quarter. But compared to the same period last year, the difference is significant and upward — in Q2 2019 “smart” attacks saw 32 p.p. growth. The share of such attacks among all others continues to rise steadily: It increased both against last quarter (by 9 p.p.) and Q2 2018 (by 15 p.p.).
The duration of DDoS sessions also continues to grow steadily in absolute and relative terms (the longest of the defeated attacks, which was also the longest smart attack, lasted for 75 minutes — an impressive figure given that most attacks in this segment get filtered in the early stages). In many ways, the overall growth is due to the increased duration of technically complex attacks, whose average and maximum times grew against both the previous quarter and, even more so, the previous year.
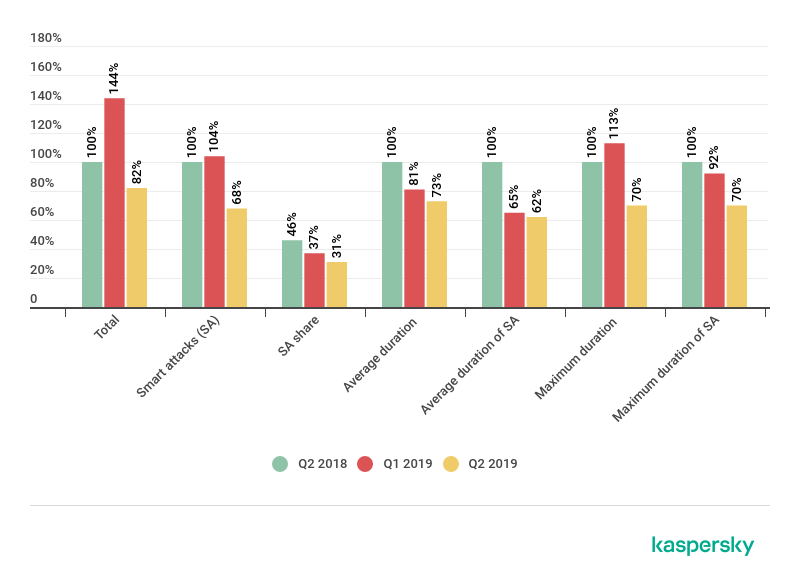
Comparison of the number and duration of standard and smart attacks for Q2 2018, Q1 2019 and Q2 2019
Therefore, the traditional spring/summer quarter decline can be put down to the drop in the share of non-smart attacks, since it is a time when amateur DDoSers are sitting exams and lying on the beach.
In the world of professional cybercriminals, the picture is different: the indicators for more complex and hence dangerous attacks show steady growth. This is especially evident when compared with the same period last year. The growth relative to Q1 is also clear to see, although less dramatic (as we predicted in our previous quarterly report). The latest figures already point to a stable trend. It will be very interesting to observe how the situation unfolds over the next trimester: will we see further growth, or will the market stabilize at the current level?
Statistics
Methodology
Kaspersky Lab has a long history of combating cyber threats, including DDoS attacks of all types and complexity. Company experts monitor botnets using the Kaspersky DDoS Intelligence system.
A part of Kaspersky DDoS Protection, the DDoS Intelligence system intercepts and analyzes commands received by bots from C&C servers. The system is proactive, not reactive, meaning that it does not wait for a user device to get infected or a command to be executed.
This report contains DDoS Intelligence statistics for Q2 2019.
In the context of this report, the incident is counted as a single DDoS-attack only if the interval between botnet activity periods does not exceed 24 hours. For example, if the same web resource was attacked by the same botnet with an interval of 24 hours or more, then this is considered as two attacks. Bot requests originating from different botnets but directed at one resource also count as separate attacks.
The geographical locations of DDoS-attack victims and C&C servers used to send commands are determined by their respective IP addresses. The number of unique targets of DDoS attacks in this report is counted by the number of unique IP addresses in the quarterly statistics.
DDoS Intelligence statistics are limited to botnets detected and analyzed by Kaspersky Lab. Note that botnets are just one of the tools used for DDoS attacks, and that this section does not cover every single DDoS attack that occurred during the review period.
Quarter summary
- In this quarter, China once again was the most targeted region by number of attacks (63.80%), followed by the US (17.57%) and Hong Kong (4.61%).
- There was little movement in the Top 3, but lower down there again appeared countries not usually associated with high levels of DDoS activity — this time it was the Netherlands (4th with 1.54%) and Taiwan (7th with 1.15%).
- The Top 10 by number of unique targets generally coincides with the ranking by number of attacks: China (55.17%), US (22.22%), and Hong Kong (4.53%) make up the podium here again. They are joined by Taiwan (1.61%) and Ireland (1%).
- This quarter’s choppiest month was April, which included peak attack time; the quietest was May immediately after.
- Statistically, the biggest share of attacks came on Monday (17.55%), while Sunday was the calmest day (10.45%).
- The longest attack (509 hours) in Q2 significantly outperformed the previous quarter’s leader, and set an all-time record since these reports began. Despite that, the overall proportion of prolonged attacks declined this quarter.
- The largest share of junk traffic in Q2 still consisted of SYN flooding (82.43%), followed by UDP (10.94%). However, HTTP and TCP traffic swapped places: the latter nudged ahead on 3.26%, while the former scored only 2.77%.
- The shares of Windows- and Linux-based botnets barely changed against the previous quarter.
- The geographical rating list by number of botnet C&C servers is dominated by the US (44.14%), followed by the Netherlands (12.16%) and the UK (9.46%). Interestingly, this quarter’s Top 10 had no place for Russia.
Attack geography
The Top 3 countries by number of attacks against targets in a particular country remained almost unchanged this quarter: China is still in first place, although its share dropped by about 4 p.p. to 63.80%. In second place is the US with practically the same share as before (17.57%), while third place goes to Hong Kong (4.61%), whose contribution to the total number of cyber attacks also changed very little.
The trend of past quarters continues, with the Top 10 again hosting some unexpected guests. This time, they were the Netherlands, ranked fourth with 1.54%, and Taiwan in seventh position with a 1.15% slice. But whereas the Netherlands is not a complete stranger to the Top 10, having entered in 2016 and flirted with it on other occasions, the result represents significant growth in Taiwan’s indicators.
The Top 10 said goodbye to France and Saudi Arabia, and Canada dropped from fourth to eighth, although in numerical terms its share actually rose to 0.93%. The leaderboard was propped up by Vietnam (0.68%), while the UK rose one position to sixth (1.20%). Singapore remains in fifth place, although its share also climbed (to 1.25%).

Distribution of DDoS attacks by country, Q1 and Q2 2019
The distribution of the number of unique targets corresponds more or less to the distribution of the number of attacks. The first four places coincide: China posted 55.17% (down, again by about 4 p.p.), the US 22.22% (up by about 1 p.p.), Hong Kong 4.53% (down by a slender 0.2 p.p.), and the Netherlands 2.34% (a significant change, since the country was nowhere to be seen in last quarter’s Top 10).
As for the remaining Top 10 permutations, besides the Netherlands, Taiwan took sixth place (1.61%) and Ireland came ninth with a share of 1%. Meanwhile, Poland, Germany, and Saudi Arabia departed the Top 10, while France (0.9%) dropped from seventh place to last, despite losing only 0.1 p.p.

Distribution of unique DDoS-attack targets by country, Q1 and Q2 2019
Dynamics of the number of DDoS attacks
The second quarter, like the first, was relatively calm, with no sudden spikes. The most activity was observed at the beginning of the quarter, and peak day was April 8 (538 attacks). This was followed by a gradual decline throughout the following month, with calmest day being May 9 (79 attacks). In early June, DDoS attack organizers perked up somewhat, but the end of the month saw another slump.

Dynamics of the number of DDoS attacks in Q2 2019
The most dangerous weekday in Q2 from a DDoS perspective was Monday (17.55%), snatching the laurel wreath from Saturday. This bucked the trend of recent quarters in which the greatest activity was observed in the middle and at the end of the week. Sunday remains the quietest day (10.45%), and there is also relative calm on Fridays (13.11%). All other days of the week, the attacks are spread more or less evenly.

Distribution of DDoS attacks by day of the week, Q1 and Q2 2019
Duration and types of DDoS attacks
The longest attack in Q2 2019 lasted 509 hours (a fraction over 21 days), and was directed against Chinese telecom operator China Unicom. It is the longest attack ever recorded in this series of quarterly reports. Last quarter’s longest attack was approximately 1.7 times shorter (289 hours).
Despite the new record, the overall share of long-duration attacks this quarter declined significantly. Only attacks lasting from 100 to 139 hours (0.11%) remained at the same level, while the share of attacks of 140 hours or more almost halved (from 0.21 to 0.13%). Most significantly of all, the share of medium-duration attacks — from 50 to 99 hours — was slashed by almost two-thirds, accounting for 0.54% of all attacks against last quarter’s figure of 1.51%. The proportion of 5–19 hour attacks fell only slightly.
Accordingly, the share of attacks of no more than four hours increased: from 78.66% to 82.69%.

Distribution of DDoS attacks by duration (hours), Q1 and Q2 2019
In terms of DDoS-attack types, SYN flooding is still the most popular, although its share dipped by roughly 1.5 p.p. against the previous quarter to 82.43%. In second place is UDP flooding, whose figure, on the contrary, climbed by 2 p.p. to 10.94%. TCP requests rose to third place with a share of 3.26%, while the percentage of HTTP traffic, conversely, fell to 2.77%. Last place still belongs to ICMP flooding, with a share of 0.59%.
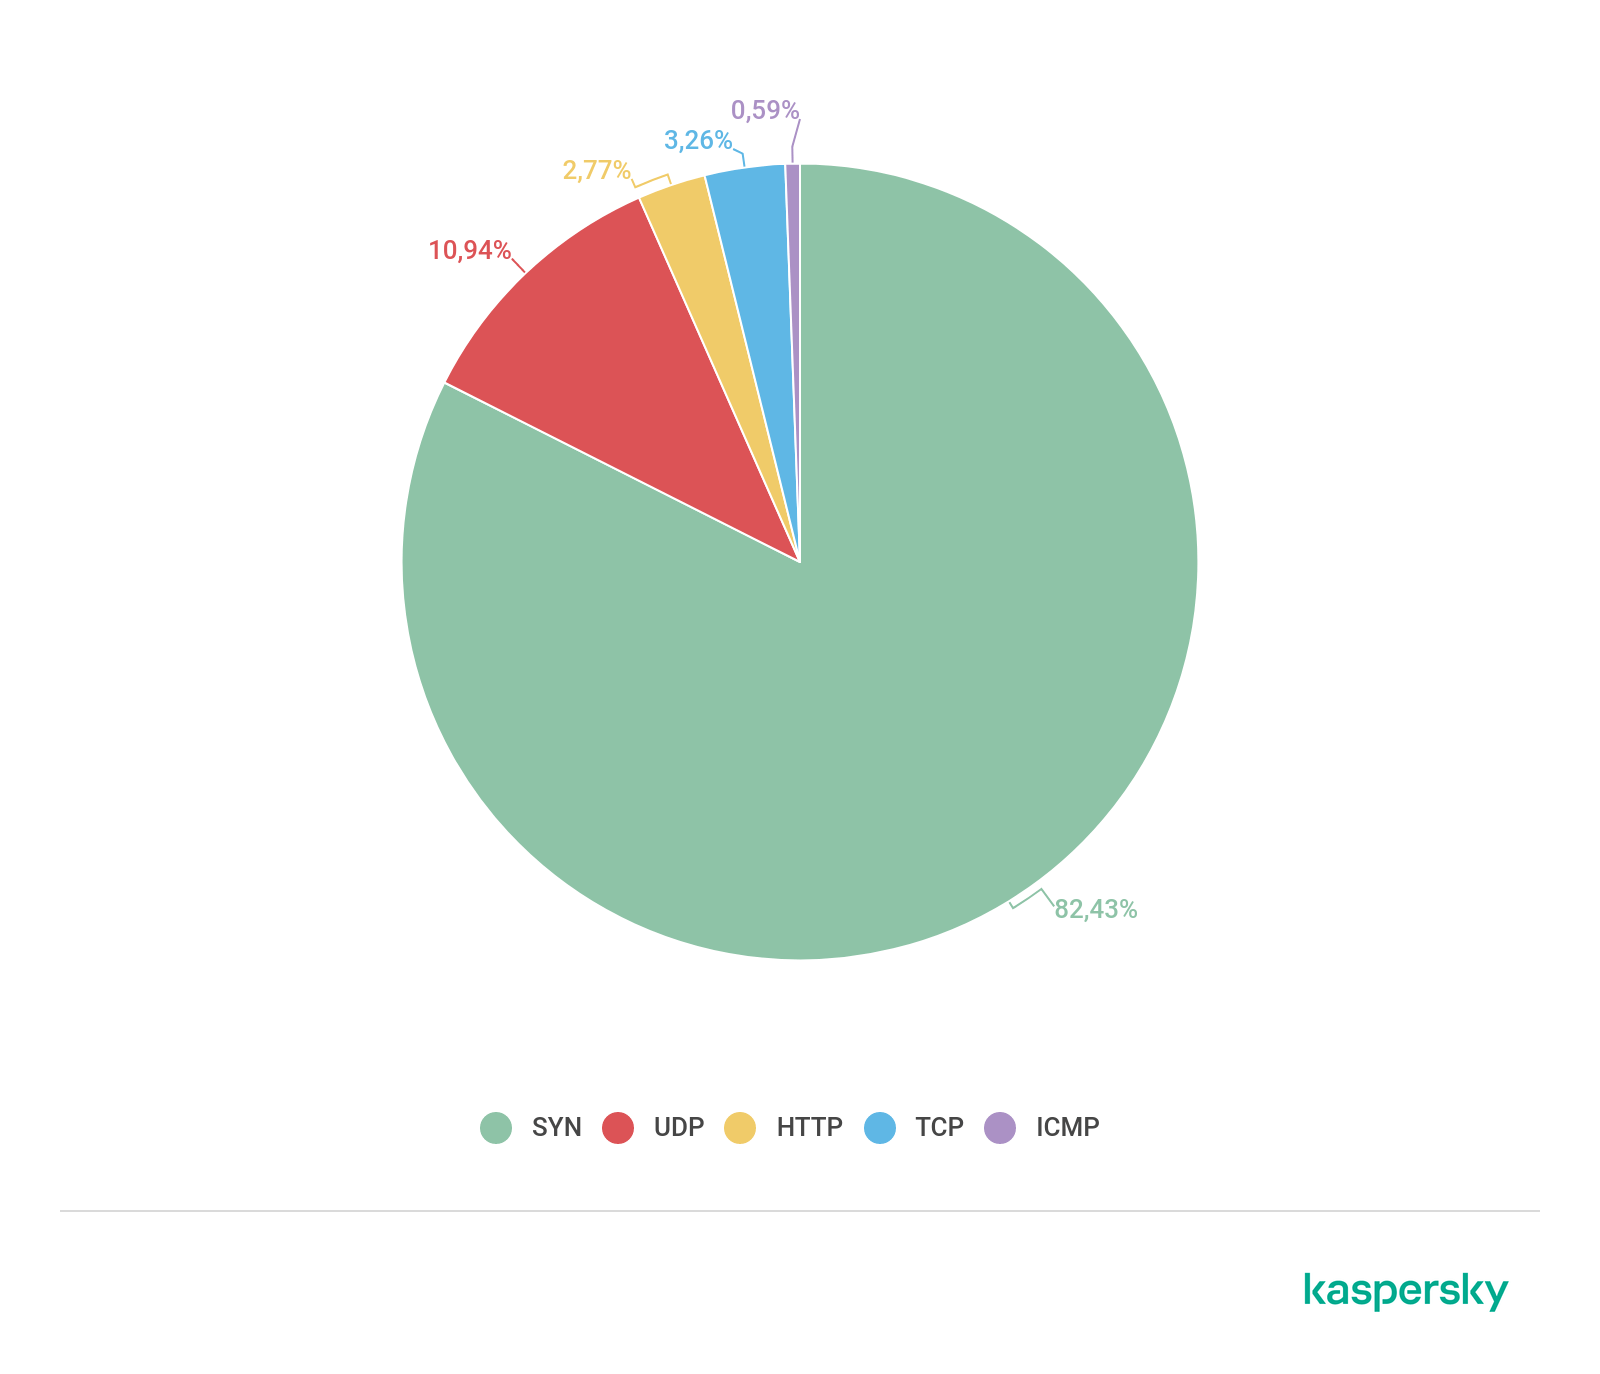
Distribution of DDoS attacks by type, Q2 2019
The distribution of botnet attacks by family remains roughly the same as in the previous quarter, with assaults against Linux systems still ahead by a wide margin. Although Xor activity faded once more, this decline was more than offset by the rise in the number of Mirai-based attacks.

Ratio of Windows/Linux botnet attacks, Q1 and Q2 2019
Botnet distribution geography
In terms of geographical distribution of botnet C&C servers, the US (44.14%) remains on top. It is joined in the Top 10 by the Netherlands (12.16%) and the UK (9.46%). China only managed fifth position (4.95%), while South Korea’s share (1.80%) was only good enough for second-to-last place. In addition, this quarter’s Top 10 welcomed Greece (1.35%), but pushed out Romania and, far more surprisingly, Russia.
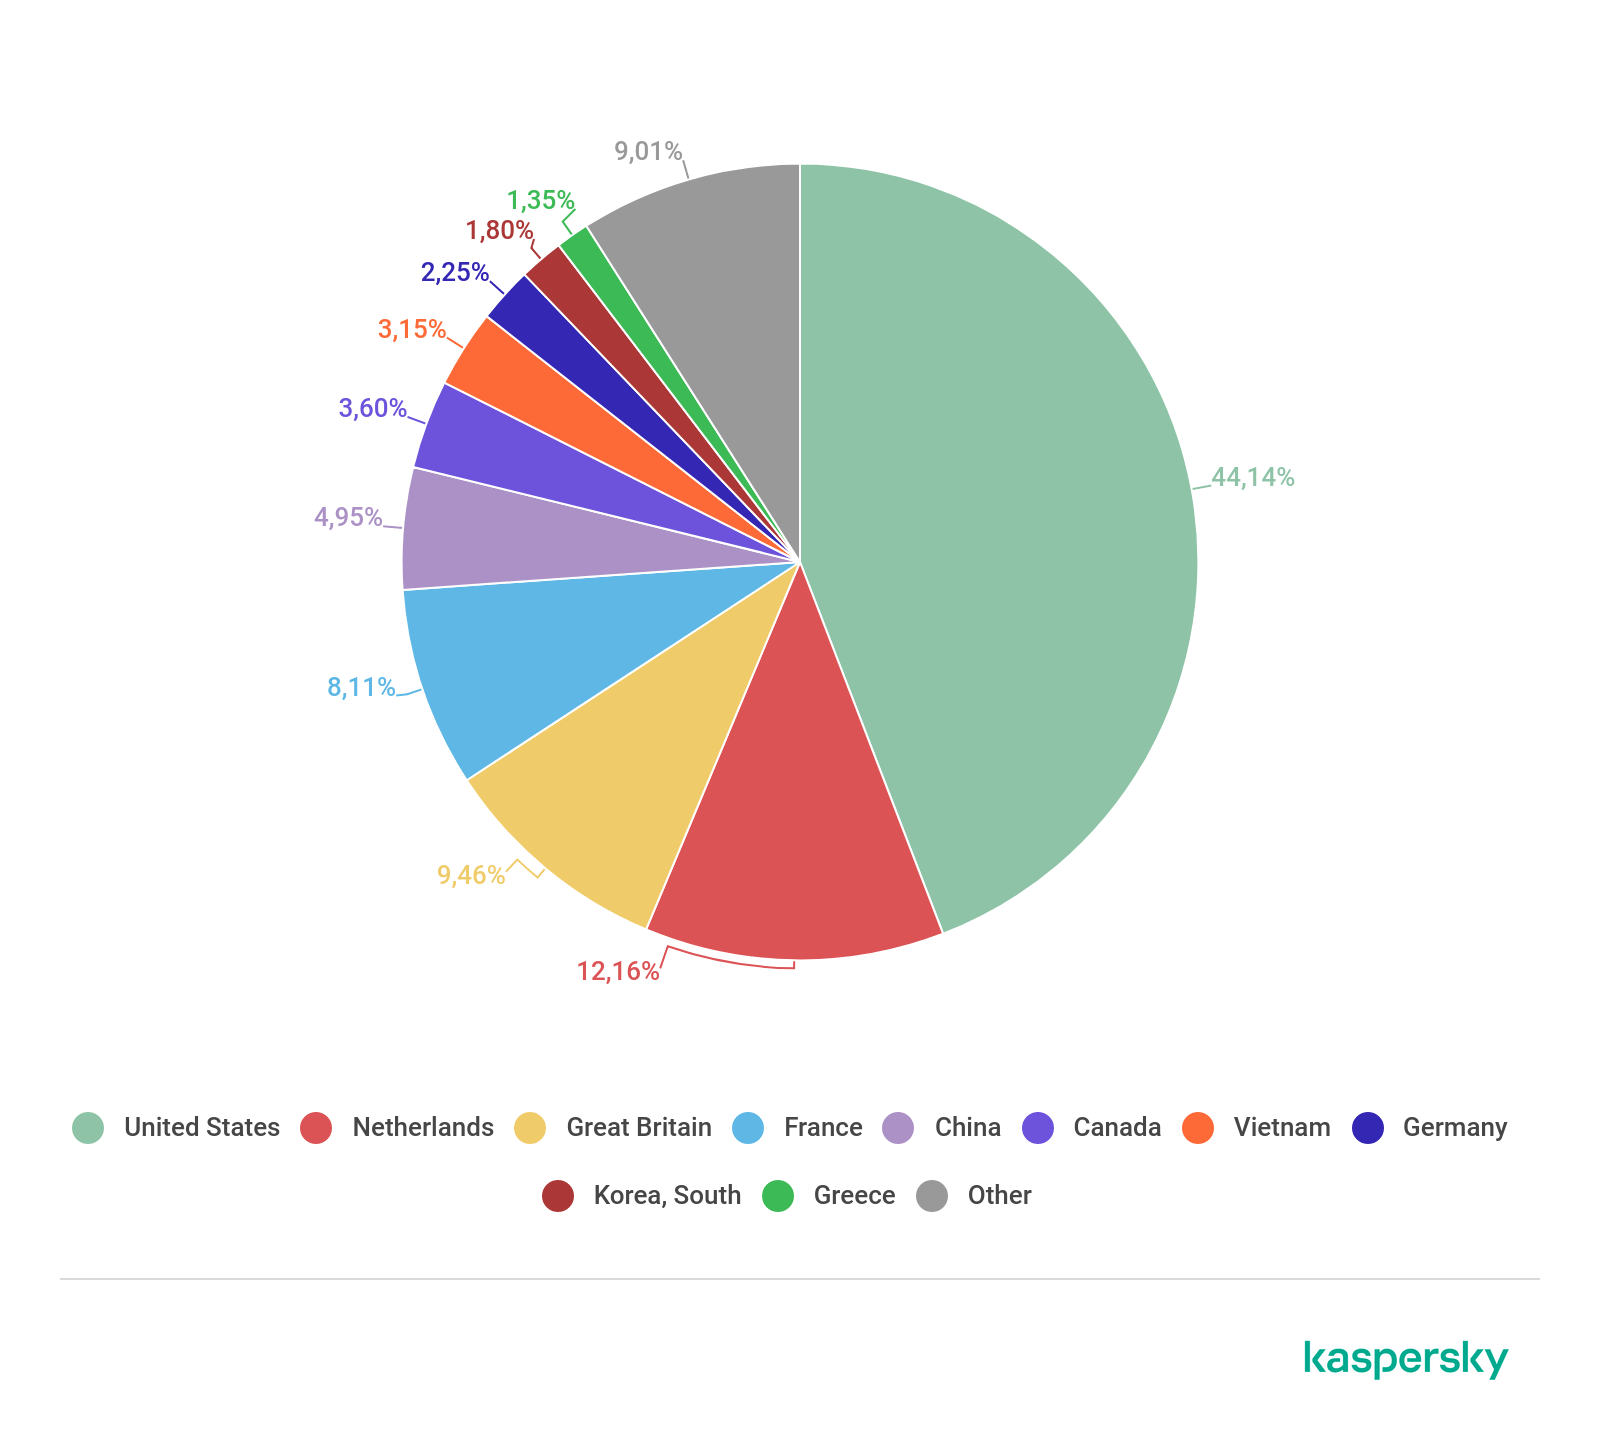
Distribution of botnet C&C servers by country, Q2 2019
Conclusion
As in several past quarters, the Top 10 geographical distributions continue to amaze. This may be not only because DDoS masterminds are looking for new places where the arm of the law is not so long and electricity prices are not too high, but because the threshold for breaking into the Top 10 is quite low. As a rule, the Top 3 leaders scoop up most of the attacks, so the shares of all other regions remain relatively small. That being the case, even small fluctuations can lead to a country rocketing up or down the rating lists.
True, this cannot completely account for the vanishing act of traditional leaders like South Korea and Russia (the latter’s absence in the Top 10 by number of C&C botnets is particularly striking). If the rearrangement is genuinely linked to a tightening of the legal screws, we should expect the rating lists to feature countries with poorly developed cybercrime laws.
The lack of DDoS spikes this quarter is clearly due to seasonal fluctuations; the summer months are traditionally more serene, if only relatively speaking.
From the same authors


In the same category


DDoS attacks in Q2 2019